
@AlphaFund: Does history always repeat itself? This chart perfectly explains "crowding" 📊
If you understand this chart, you'll know why AI stocks are so hot right now.
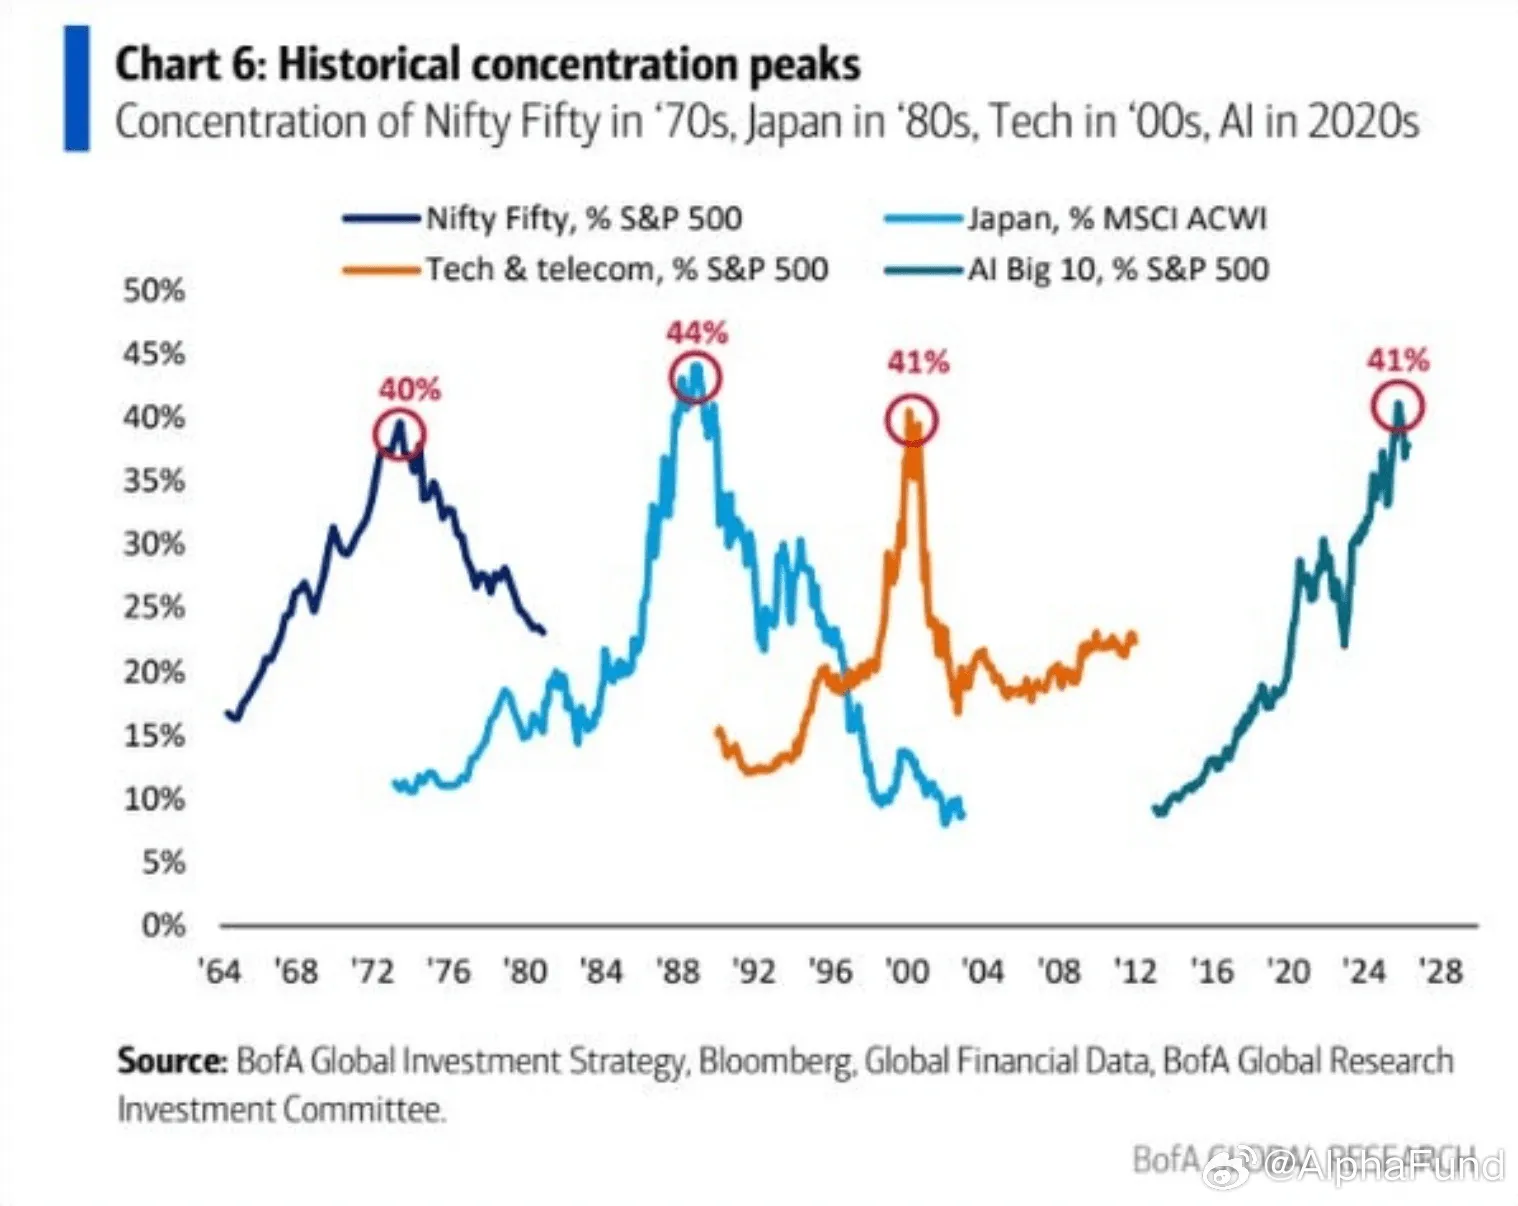
Bank of America compared four epic instances of "crowding":
• 1970s Nifty Fifty: Once surged to 40% of the S&P 500
• 1980s Japanese Bubble: Surged to 44% of the global index
• 2000s Tech Bubble: Surged to 41%
• 2020s AI Giants: Now it has surged to 41%, exactly the same as the previous peaks
To put it bluntly:
Hot money piles into a handful of leading stocks, driving their weighting higher and higher until it becomes unsustainable.
The narrative is different every time (Consumption/Japan/Internet/AI), but the script is pretty much the same:
First, a collective euphoria, then a collective crash.
History doesn't repeat itself, but it often rhymes.
The concentration in AI leaders has now reached the peak zones of past bubbles, a signal worth keeping a close eye on.
 微信扫一扫打赏
  支付宝扫一扫打赏
Comments (0)